Overview

Kyenjojo District was established on 28th November 2000 being curved out of Kabarole District and later gave birth to Kyegegwa District on 22nd December 2009. Administratively, the district has one county (Mwenge) and three constituencies (Mwenge North, Mwenge Central and Mwenge South), 18 sub counties, 9 Town Councils, 109 parishes, 47 wards and 853 villages.
The District boarders with Kibaale in the North, Kyegegwa in the East, Kamwenge in the South west, and Kabarole in the West and it is located in the mid-western at approximately 250Kms from Kampala City.
Kyenjojo District
Background
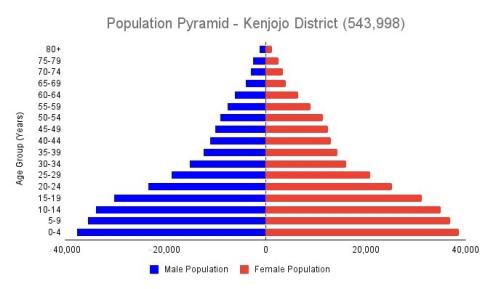
Demography
Health
Socio Economic
• Location: Latitude 0.609292
and longitude 30.640123
• District creation 28/11/2000
• Distance from Kampala 250kms
• Total area 2353.2 sq kms
• Land area
• Area of water bodies
• Annual rainfall 750mm to 1000mm per annum
• Women headed households 21%
• Child headed households
• No. of sub counties 19
• No. of Town councils 12
• No. of parishes 168
• No. of villages 875
• No. of District Councilors 58
• Proportion of female District Councilors 17/43
• No. of Hospitals 01
• No. of Health Centre IVs 01
• No. of Health centre III’s 13
• No. No of Health centre II’s 277
• No. of Licensed drug shops 62
• No. of allied clinics
• Population within 5 km to health facility 59%
• Catchment population by health unit
• Doctors-population ratio 1:37360
• Nurse-population ratio 1:2939
• Clinician-population ratio 1:18036
• Deliveries in health facilities 58%
• Ratio of midwives to pregnant women
• Disease burden by Malaria
• Death Rate
• Total Population 541,406 (Proj. June 2021)
• Number of Males 270058
• Number of Females 271348
• Sex ratio 98.0
• Population Density 95.7 persons
• Number of households 92,011
• Average household 4.6
• Women in reproductive age (15-49 years) 21%
• Annual Population growth rate 3.88%
• Primary school going age [6-12) yrs. 73%
• Adolescents (10 -24) years 24%
• Ethnic grouping Batooro, Banyankole,Bakiga.
• Commonly spoken language Rutooro, runyakore-rukiga
• Population below poverty line 11.1%.
Education
• No. of government aided Primary schools 28
• No. of private Primary schools 260
• No. of nursery schools 235
• No. of government aided secondary schools 11
• No. of private secondary schools 46
• No. of technical schools 01
• No. of primary teachers’ colleges 01
• No. of Nurses’ training schools 03
• Primary school enrolment 71811
• Pupil teacher ratio 76:1
• Primary school dropout rate 2% (2019)
• Desk-Pupil ratio 5:1
• Pupil-classroom ratio 80:1
• PLE performance Div 1 Total 895
• PLE performance Div 1 Girls 459
• Secondary school enrolment 5261 (2019)
• Student teacher ratio 42:1
• Secondary school dropout rate 3% (2019)
• Desk-Student ratio 5:1
• Student-classroom ratio 43:1
• Literacy rate
• Literacy rate among women
• Literacy among men
• No. of community development organization
• No. of NGOs
• Number of organized women groups
• Total length of district roads
• Road length in good condition
• Road length in poor condition
• Length of community roads
• Dependency ratio
• Average annual rainfall
• Local radio FM stations
• Number of CBOs registered
• Households using firewood for cooking
• Households using electricity for lighting
• Households using paraffin lighting
• Households using charcoal for cooking
• Latrine coverage 97%
• Total Fertility Rate 5.8 child/woman
• Infant Mortality Rate 58/100,000LB
• Under five Mortality rate 22.4%
• Stunting
• Maternal Mortality Ratio 307/100,000 LB
• No. HIV + pregnant women on ART prophylaxis 250
• Vitamin A Supplementation Coverage 52%
• Polio immunization rate 99% BCG immunization
rate 96%
• Proportion of Orphaned children 10.3%
• Contraceptive Prevalence Rate 37%
• HIV prevalence 5.7%
• ANC coverage 46%
67.2%
59.5%
74.8%
3873
29
387
2197.5km
664.38km
467.952
1173.4
108.3
850mm
02
72
42,022
20,2II
52,011
62,022Finance
District Vision:
District Mission
KYENJOJO DISTRICT
PROFILE
Data Sources: Census 2014, District Development Plan III 2020/21-2024/2025, Annual
work plan 2020/21, District Education Management Information System, District Health
Management Information System, OVCMIS,
2021 National livestock census and annual
budget, Annual child register at health Centre,
adolescent register at Health Centre,
General register.
“A healthy, productive and
prosperous population.”
“To achieve sustainable social
economic development for the
people of Kyenjojo in conformity
with national and local priorities.”
• FY 2020/21 approved budget
• Donor contribution
• Capital Development budget (2020/21)
• Recurrent budgets (2020/21)
• Central government grants (2020/21)
• Locally generated revenue (FY2020/21)
• No. of SACCOs
KYENJOJO DISTRICT
SOCIO-ECONOMIC &
DEMOGRAPHIC PROFILE
MAP OF KYENJOJO DISTRICT
8,874,047,475
1,532,247,743
5080,112 940
6,061,604,094
35,033,884,971
248,399,462
3